
Traders must master many skills. One of these is reading candlestick patterns. To the trained eye, a series of candlesticks yields valuable market insights that can inform short-term trading decisions.
What Are Candlesticks and Candlestick Patterns?
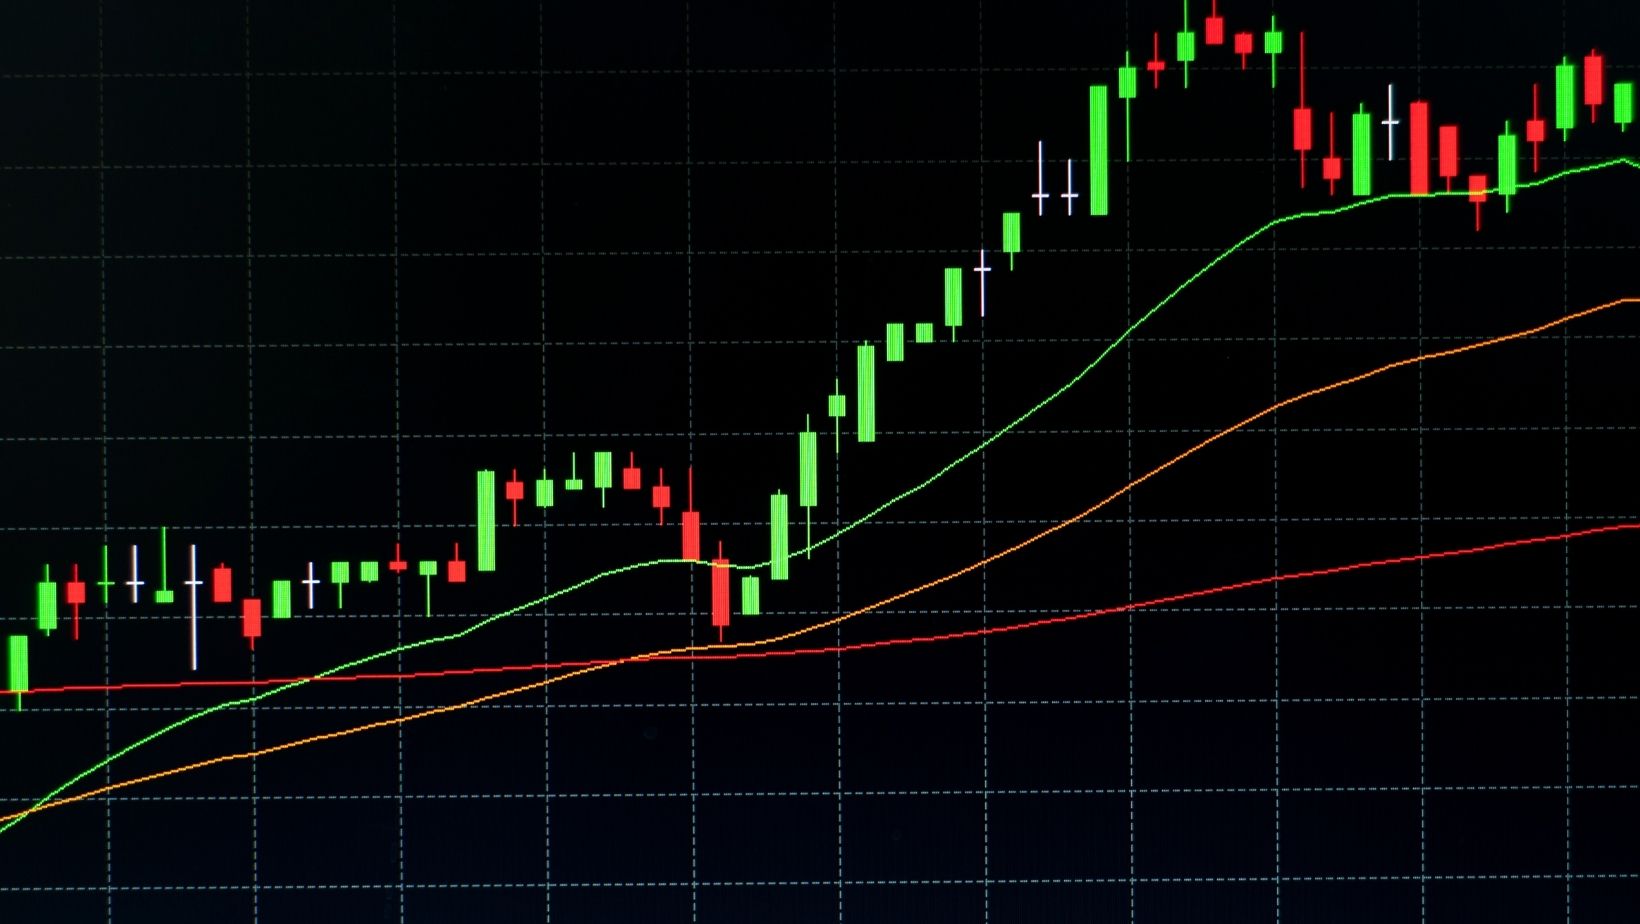
Candlesticks are a tool that lets you visualise how prices for a particular asset have changed in a specific period. They have three essential characteristics:
- Body: The body refers to the rectangle that spans the distance between the asset’s opening and closing prices.
- Shadow: The shadow, also called wick, is the distance between the open or close and the highest or lowest price for the day. Candles may have an upper wick, a lower wick, or both. In a bullish candle, where the close is higher than the open, the upper wick is the distance between the high and the close. In a bearish candle where the close is lower than the open, the upper wick corresponds to the distance between the high and the open.
- Colour: A bullish candle has a different colour from a bearish candle. The actual colour depends on the trading platform, but green or white is common for bullish candles, while red or black is a common colour for bearish candles.
The day’s candlestick will tell you the following information:
- How large the difference between the day’s open and close is
- If the price climbed or fell during the day
- How far from the close or open the day’s high is
- How far from the close or open the day’s low is
You can use a series of candlesticks (i.e., candlestick patterns) to predict the direction in which the price will move in the near future. Therein lies its power to inform trading decisions. If you can infer when prices are about to increase or decrease, you can make a long or short trade at the right time and maximise gains.
Some say there are 42 candlestick patterns. Others say there are 55. Yet some claim there are 75. Regardless of the actual count, every one of these points of view agrees that there are many candlestick patterns that a serious trader must learn, and one of the most important is the morning star.
The Morning Star: Reversing a Downtrend
The Morning Star is a powerful bullish reversal pattern. It signals that selling pressure is fading, buyers are stepping in, and the price is about to increase. It has ‘buy now while it’s low’ written all over it.
The morning star is a hopeful sign if you see it form after a series of bearish candles, that is, if there’s a clear market downturn. In this case, the morning pattern may be a sign that:
- The market is approaching its absolute bottom
- The price cannot go any lower
- Market sentiment is about to shift
- Selling will stop
- Buying will begin
In other words, a morning star amid a clear downtrend (and if confirmed through the analysis of other indicators) can be a sign that an uptrend is imminent.
How to Identify a Morning Star
The following three candles comprise the morning star pattern:
1. First Candle: Long and Bearish
The first candle is characterised by a lower close than open, with a significant difference between the two that gives the candle a long body. The large gap between the open and close confirms the market’s downward trend.
2. Second Candle: Short, Better If Gapped
The second opens with a jump down. That is to say, there’s a clear gap between the first candle’s close and the second candle’s open. The second candle is below the first, and there’s no overlap between the two.
The gap indicates active after-hours trading. The morning star’s second candle is even more of a reliable indicator if something happened post-market, like a news announcement or event that could have driven the gap.
Note on the gap: The gap between the second candle’s close and the first candle’s open may be non-existent, but the morning star pattern may remain valid. You can infer this if there’s a clear market downturn, there’s reason to believe the market sentiment is about to shift, and your analysis of other indicators confirms your morning star predictions. The gap may be absent in highly liquid markets or during extended trading sessions.
The second candle may be bearish (higher open than close) or bullish (higher close than open). It doesn’t matter. What’s important is that it must be short-bodied; it may even be a doji. A doji is the type of candle formed when the open and selling prices are identical or very nearly the same.
The small or non-existent difference between the opening and closing prices can be interpreted as a weakening resolve among sellers—i.e., a shifting market sentiment.
3. Third Candle: Long and Bullish
The third candle in the series indicates a higher close than open with a significant difference between the two values, which gives it a long, bullish appearance and confirms the weakening selling momentum that the second candle hints at. Note that the third candle must close well beyond the midpoint of the first candle to indicate that buyers have regained control and will start pushing the price upward.
How to Trade the Morning Star
Wait for the pattern to fully form before taking action. Enter a long trade only after the third candle closes at a significantly higher level than the midpoint of the first candle. Note that the morning star pattern is more reliable if the third candle has a higher volume.
For additional confirmation, validate your conclusions using other tools and analytical techniques. For this purpose, you can use the Moving Average Convergence Divergence (MACD) and the Relative Strength Index (RSI).
Check market conditions. Read up on market news and find the possible driver of the significant after-hours trading that caused the short-bodied and gapped second candle.
When you finally put in a long trade, you can minimise your downside risk by setting your stop-loss limit to just below the low (i.e., just beneath the lower shadow) of the second candle.
Pinning Your Hopes on the Morning Star
As you trade top Mena & UAE stock, learn and use the candlestick pattern analysis to predict future price movements. The morning star is one of the most renowned candlestick patterns. It indicates that the market is about to turn, the buyers are about to get the upper hand, and the price of the security is about to rise. If you see a morning star, it’s a sign to buy now while the price is still low so you can gain from the imminent climb.
")

